Where to put it
The full table, and the balcony problem.
Read morePlug-in Solar GB / How the calculator works
Every number comes from PVGIS, queried on 13 September 2026 for an 800 watt device at one representative point per region, with 14 per cent system losses. Here's what that means and what it leaves out.
Every generation figure comes from PVGIS, the Photovoltaic Geographical Information System published by the European Commission’s Joint Research Centre. It is free, open, needs no registration, and it is the standard reference for this kind of calculation. We are not the source. We just read it and show you the result.
We queried it on 13 September 2026 for an 800 watt device, 14 per cent system losses, at one representative point in each of the thirteen regions the calculator covers. The raw response sits beside this file in our own records and can be checked against a fresh query at any time, because PVGIS is a public tool.
We queried four arrangements for every region, because where a panel goes changes the figure more than which region it is in.
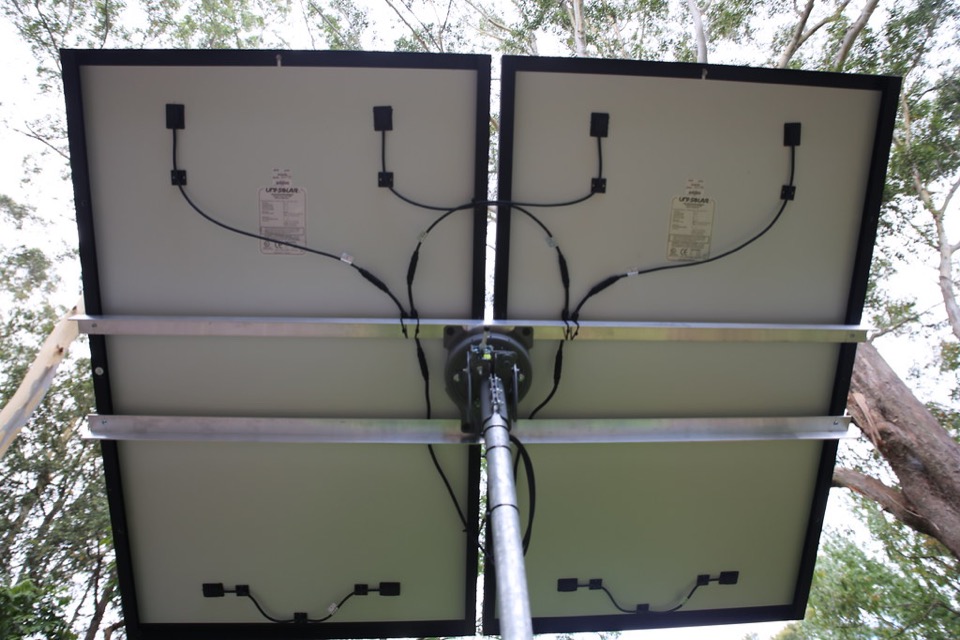
Averaged across all thirteen regions, a garden frame comes within about one per cent of the roof figure, a south wall gives about three quarters of it, and an east or west wall gives about half. The full table is on the where to put it page.
| Region | Garden frame | Roof pitch | South wall | East or west wall |
|---|---|---|---|---|
| South East | 890 | 897 | 645 | 424 |
| South West | 816 | 822 | 594 | 417 |
| East of England | 795 | 802 | 594 | 412 |
| Wales | 792 | 798 | 575 | 385 |
| London | 789 | 795 | 582 | 409 |
| East Midlands | 754 | 760 | 564 | 391 |
| West Midlands | 746 | 752 | 555 | 389 |
| Yorkshire | 729 | 736 | 550 | 376 |
| North East | 727 | 734 | 558 | 372 |
| Northern Ireland | 708 | 714 | 534 | 367 |
| North West | 684 | 689 | 505 | 359 |
| Scotland, south | 656 | 661 | 491 | 337 |
| Scotland, north | 623 | 628 | 470 | 321 |
PVGIS was queried at one city per region, not at every postcode. A coastal address and an inland one in the same region will differ, and the figure also assumes nothing shades the panel at any time of day. Treat it as a ceiling under ideal conditions rather than a forecast for your actual roofline, wall or fence.
It will not turn a generation figure into pounds saved. That needs a UK price for the kit and an electricity tariff, and we do not have a figure for either that we would put our name to. If you want that worked out for your own house, send us your details and we will talk you through it honestly rather than print a guess.
Vendor listings quote figures for plug-in kits, but those are vendor claims, not a cited source, so we do not repeat them. Electricity tariffs vary by supplier and by month. Both would need to be sourced properly before a saving figure meant anything, and neither currently is. We would rather leave the box empty than fill it with a plausible number.
Trust the method more than the last digit. PVGIS is a recognised European model and the inputs are stated on this page. The precision of the output does not mean your own roof will match it exactly, which is why we call it a ceiling.
No, and it never claims to. It knows your region and your chosen mounting. Send us your postcode and we will look at your actual address.
That is a standard PVGIS default for cabling, temperature and inverter losses on a small system. We kept the default rather than choose a flattering number.
Run your region and your surface through the calculator on the home page, then send us your postcode.
Get a quote for my addressThe calculator uses one point per region. Send your postcode and we'll run it for your address.
Your region, your name and email, and the spot you have in mind. We confirm the figure for your actual location, check the rules for that spot, and say what fitting would involve.
We reply by email. Your details stay with us and nobody pays us commission.